Weekly Newsletter
Freedom Calls: 6/10/25, “The Gaza surprise and why stocks are still good from here”
by
Freedom Asset Team
October 6, 2025
7M

Freedom Calls: 6/10/25, “The Gaza surprise and why stocks are still good from here”
From the team at Freedom Asset Management
Another week, the tail end of another typhoon... It was a bit overcast and blustery in Hong Kong this weekend, but much better weather than we all feared as we caught the edge of another typhoon. The yachts were all dutifully tied up at the Royal Hong Kong Yacht Club on Sunday afternoon (see below).

Pictured: the view over the RHKYC looking out to Kowloon, Oct 2025
The Gaza surprise
Let nobody say that Trump does not surprise; last week it was Gaza and Qatar on one side of the world, and the US government shut down on the other. We are not worried about the US government shutdown - that is just part of the theatrics of modern-day US politics, and whilst some are keen to play up its significance, it just isn’t, and the market walked right through it all and ended up on the week. There is in fact a scenario that Trump uses this shutdown to achieve some government savings, which will be received well by the market.
Arise Donald, King of Palestine?
The real surprise to us was Gaza. Regular readers may remember the conclusions of the " Jordan issue” and "Egypt issue" (which looked at the possible relocation of the Palestine people to either Jordan or Sinai in a post Gaza/West Bank world). The conclusion was that the only viable solution to the Palestinian question was a Palestinian state - and that they should consider introducing a King as a way to deal with the shortcomings of Middle Eastern democracy. Well, roll the clock forward a few months and here we are - “King" Donald at the head of a committee essentially in place to establish and oversee the operation of a Palestinian State. It sounds absurd at first, but maybe it isn’t.
As the weekend moved on, tangible progress was being made. Hamas’ negotiators agreed in principle to the basic terms of the plan, which sees Hamas release all hostages, disarm and have no further role in the governance of the state. Qatar pressured Hamas to agreed to the deal, but this only came after Trump gave Qatar an unmatched security guarantee similar to Nato’s Article 5. Nobody is really quite sure how he was able to bypass Congress to do that, but the fact remains that Trump’s word was enough to convince the Qatari’s that they would not be attacked by Iran for backing the US and Israel here - and brought Hamas to the table.
As of Saturday, Trump has also called out Israel to stop bombing Gaza. Unfortunately, according to the WSJ, there is still a difference of opinion between the Hamas fighters (in Gaza) and the Hamas negotiators (in Doha). But this deal has the backing of all the key Gulf states and is endorsed by all the key Western nations. It might just work. Let’s keep our fingers crossed.
If Trump pulls this all off, it will be an extraordinary deal.
We think stocks are still good from here
With every move up in markets, you will hear someone calling "the end is nigh". My favourite saying is this business is “eminent economists have confidently called 19 of the last 2 recessions”. The Economist was kind enough to acknowledge and quote a version of this a few months ago (as a reminder to us all). Whatever the doom story this time, you will always find a willing journalist to indulge that particular economist with their theory. As bad news sells more than good, we do tend to get surrounded by these calls.
I pulled this chart from Ned Davis Research last week. People perhaps over focus on the length of a bull market, and the truth of bull markets is that you often make the most money in the last couple of years of a bull market. Just ask former Fed Chair Alan Greenspan - he famously was calling the end of the dotcom bubble on 5/12/1996, with his "irrational exhuberance” speech. As we later came to know, the bull market for the NASDAQ would last another 1,191 days until 10/3/2000, albeit not completely in a straight line - and some of the best returns came towards the end.
Anyway although history never repeats exactly, the chart below, suggests for where we are in days/percentage gains, there is another 2 years before we hit the excesses of 2007 and the GFC.
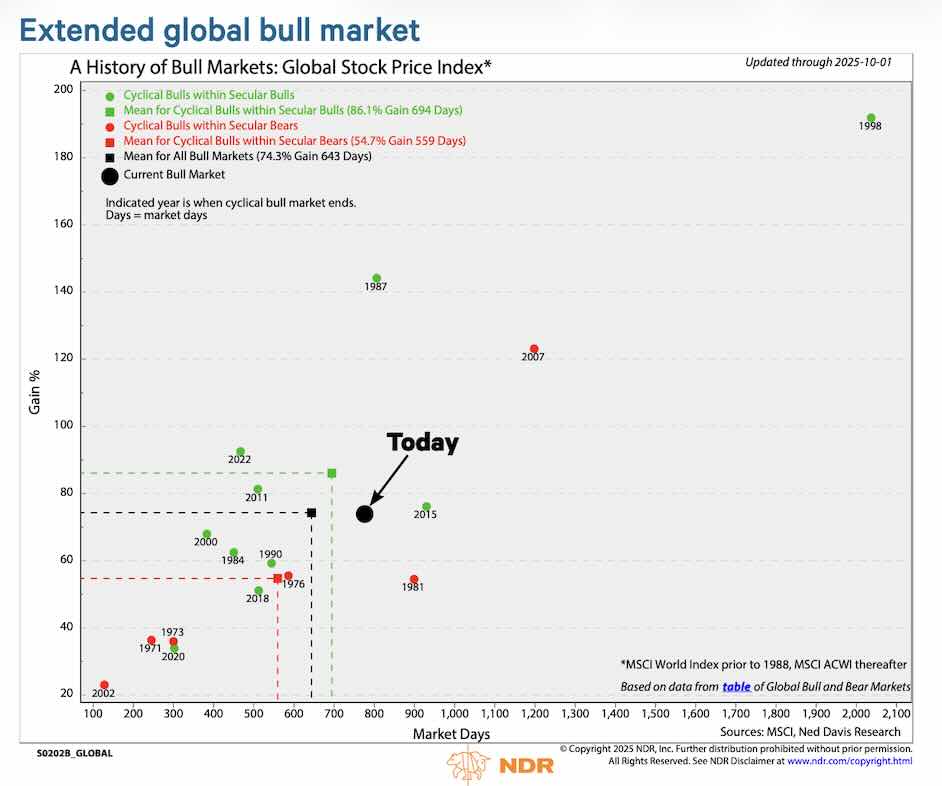
Justin’s piece looks at this further (see below) and concludes that the current high level of valuations are supported by the economic backdrop and shouldn’t preclude further stock market progress being made in the coming weeks and months. We agree with him.
Performance (a good week all round)
We held an Investment Committee (ICOM) for OGF, our balanced strategy, last week in Abu Dhabi. We are letting the performance run - we are about 62% equities and we will let that run to 65% before we trim. We topped up our tech exposure a little and also our emerging market exposure, funded from S&P500. The fixed income component at c 35% remains in short dated (<1 year) US Treasuries and ultra short high quality credit - so we are not taking any duration risk and only minimal credit risk. The key drivers of our success this year have been good allocation choices to Japan, Asia ex Japan, Tech and the star of them all Defence.
OGG had a good week up 2%, and USVIP continues to shine, now up 13.8% since the fund was launched and the fund goes over $20m today with last week’s inflows. MINC is stealthily growing with very low volatility. It was a delight to have key ICOM member Ramon Eyck visiting clients with us in Abu Dhabi, Dubai and Saudi last week to talk through MINC and OGF.
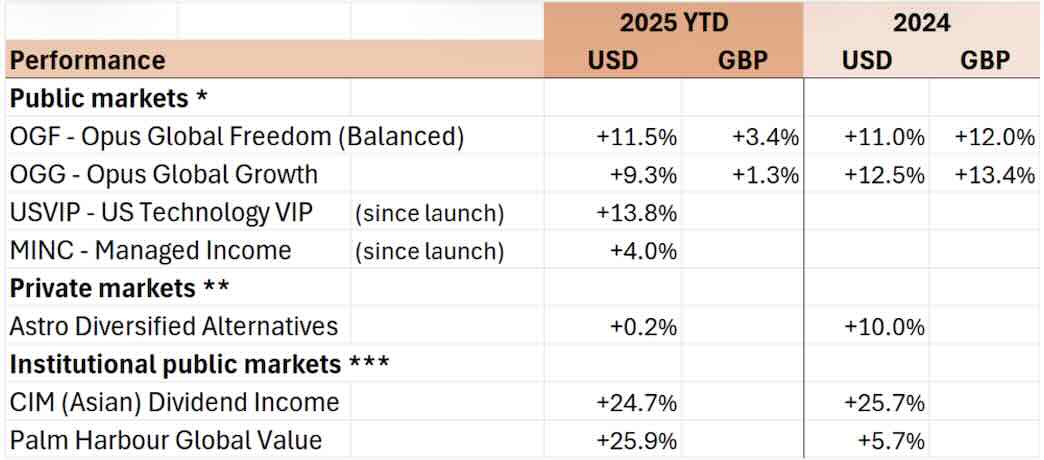
Capital at risk. Returns in US dollars unless otherwise stated. Source: * Estimates Freedom Asset Management as at 5/10/25. Please note depending upon how the funds are invested a small number of underlying funds can price 1-2 days after we take our estimates above so final published NAVs may vary. Estimated GBP returns are from a $1.25 FX rate on 31/12/24. Please note launch dates of USVIP 12/2/25 and MINC 20/5/25. ** Note fund prices quarterly and includes 5% discount to NAV expressed as 5% performance above for 2024, *** Morningstar as at 5/10/25, I shares for CIM Dividend Fund, F shares for PHC Global Value Fund.
Our articles this week:
- Cody Willard, Adviser to US Technology VIP Fund, talks about how valuation discipline is a key element of investing in tech revolutions in “Value Investing in the Technology Revolutions” .
- Justin Oliver, Adviser to the Opus Global Growth Fund (OGG), “High valuations don't cause bear markets”. We are pleased to note that Justin has now relocated with Canaccord to the UAE, so will be much easier to meet in person as we continue to grow that strategy in the Middle East.
This week I shall be based mainly in Hong Kong, ending up the week in Abu Dhabi. Next week it is London and Guernsey for me.
Wherever you are, please let me wish you a wonderful and peaceful week ahead.
All the best,
Adrian
Co-Founder // Freedom Asset Management
Guernsey // Abu Dhabi // Hong Kong
M: +44 7781 40 1111* // M: +971 585 050 111 // M: +852 5205 5855* (*also WhatsApp)
-----------------------------
“Value investing in the Technology Revolutions”, 6/10/25
By 10,000 Days’ Cody Willard, Adviser to the US Technology VIP Fund
We always say that “We are Revolution Investors”. But to be clear, our approach is also about not just maximizing our potential gains, but also minimizing risk by understanding a company’s profit potential and, frankly, being a value investor — in our own Revolutionary way — within our Tech Revolution Investing framework. That said, we don’t simply look at a company’s P/E ratio or its Forward P/E ratio. Our approach is much more detailed, nuanced and deeper than that.
We’ve spent our careers being early investors in the most societally and economically impactful Tech Revolutions, but that’s just the start. From there, we study each company that we think will either build the Revolutionary platform or find an inflection point in the future from its positioning in any respective Revolution. We listen to company’s conference calls, study the management’s vision for the company and get a sense of just how brilliant (or not) each company’s CEOs and other executives are.
From there, we build a financial model for every company we ever analyze, whether we think we might buy the stock or not. We look out 3, 5, 7, even 10 or 15 years sometimes with our financial models, making assumptions about topline growth rates, gross margins, operating expense growth and more to get some semblance of an idea of just how profitable each company will be in the future.
It’s the 5 year numbers -- layered with our understanding of management’s vision and the Tech Revolution the company is positioned for -- that really drive our decision making process about whether a particular stock is a “good value”. When we’ve put in the hard work to get a sense of a company’s profit outlook 5 years out, we can then make some assumptions about what multiple that company will be trading at in 5 years if we’ve been right about the fundamentals (companies with stronger growth rates and high profitability typically trade at higher multiples than companies with slow or no growth and low profitability, obviously).
We can then model out what our expected annualized five-year return potential for each stock. Here’s a matrix of our current longs in the US Technology VIP Fund:
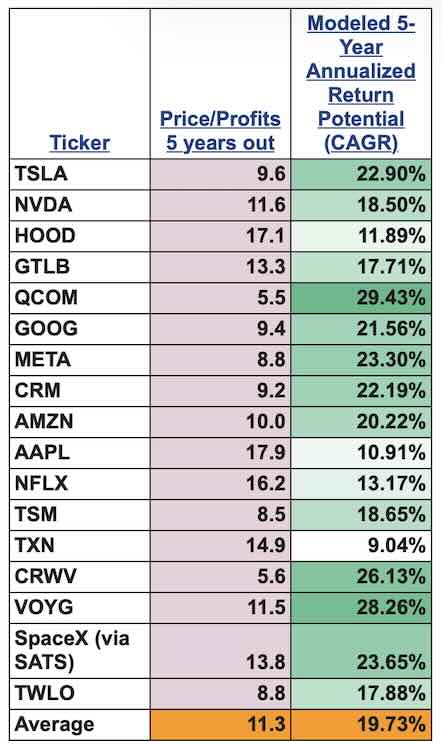
Source: 10,000 Days, Oct 2025, Proprietary analysis
This is still only the beginning of our work in being value Revolution Investors. We also build out algorithms that use our valuation and expected returns models along with Revolution Investing Rating (just how Revolutionary a company is positioned to be on an exponential ratings scale), downside risk potential, our conviction level, how near or far each respective Revolution is from impact and more data points.
I’ve been using this framework, modeling and algorithmic approach to Revolution Investing for decades now and it helps keep us in the most Revolutionary companies that this planet has ever seen and to help us avoid major drawdowns; like those that come with shotgun approaches to investing in every shiny object in any particular trillion dollar Tech Revolution.
I expect that some of our long-time holdings, including Apple, Google, Meta, Amazon, Tesla, etc, are the only companies that have the ability to spend trillions of dollars building the platforms upon which The AI Revolution and The Robotics Revolution will run. Most of these platform builders can easily go up another 10-20x over the next decade or so based on our financial and algorithmic models.
And as our job is also to try to find the stocks of some of the smaller companies that will go up 100x-200x like some of these names have for us already over the past few years and/or decades — and we think we have a handful of names that can go up like that over the next few years and decades like some of our existing positions have over the last few years and decades based on our financial and algorithmic models.
With this analysis in place, looking out over the next few years, I’ve never been more excited about the setup for Revolution Investing than I am right now.
Cody Willard
--------------------------
"High valuations don't cause bear markets”, 6/10/25
By Canaccord’s Justin Oliver

The US stock market is discounting the ongoing resilience of the economy and corporate earnings. It is discounting that the odds of a recession over the coming years are low. The longer the economy is expected to grow without a recession, the more sustainable high valuation multiples can be, since earnings growth can be expected to justify those valuations.
High valuations by themselves don't cause bear markets. Instead, recessions cause bear markets by depressing both earnings and valuation multiples. Corrections occur when widely feared recessions cause valuation multiples to fall. However, those multiples quickly rebound when the expected recession doesn't happen, allowing earnings to continue growing.
The S&P 500 experienced a correction earlier this year. Its forward P/E (i.e., the multiple using forward earnings as the “E”) fell from about 22.0 at the start of this year to 18.0 on April 8. Now it is back above 22.6. Leading the way down in the S&P 500’s correction was a sharp drop in the forward P/E of the Magnificent-7 stocks from 31.0 to 22.0. It is now back at 30.4 (see below).
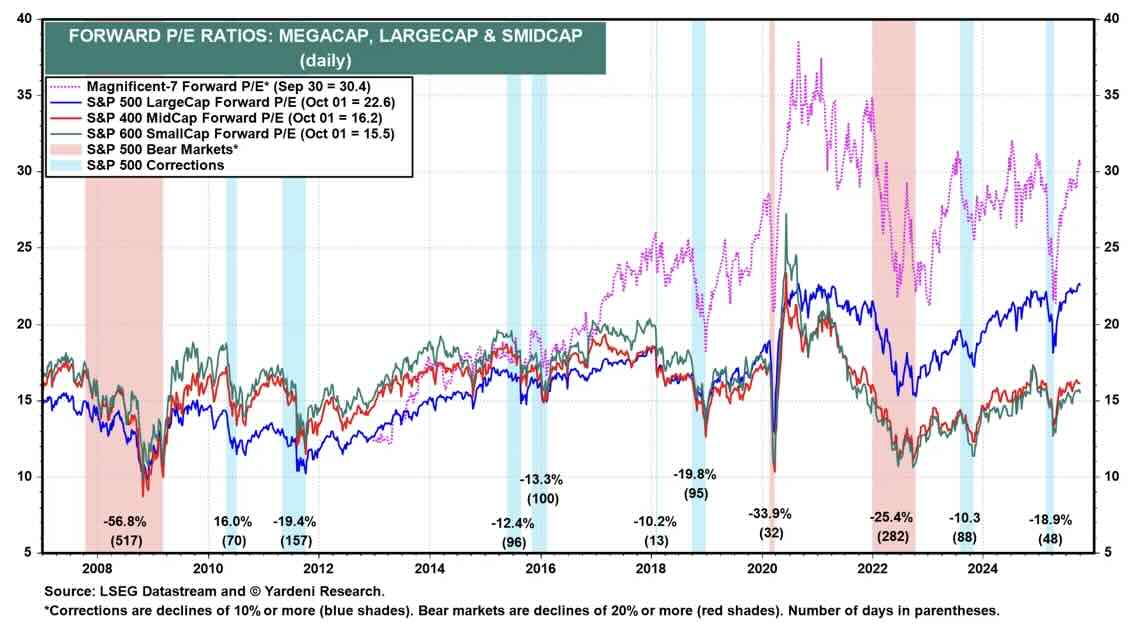
Usually in recessions and bear markets, the forward P/E of the S&P 500 falls into the single digits. During the previous bear market, the forward P/E bottomed at 15.1 on October 22, 2022. That was a relatively high P/E, which occurred because the most widely anticipated recession of all time was a "no-show".
On a monthly basis, the forward P/E of the S&P 500 rose to 22.6 in September. That was well above the median forward P/E, which was 19.2. The large gap between the two is attributable to the concentration of the S&P 500's market capitalization in the Magnificent-7.
During September, 46.0% of the S&P 500 companies sported forward P/Es exceeding 20.0. Only 7.8% had forward P/Es under 10.0%.
The forward P/Es of the S&P 500 Value and Growth indexes are historically high at 18.4 and 28.5 respectively. The spread between the two is also historically high. The spread between the forward P/Es of the Russell 2000 and the S&P 600 is historically high, too.
The prospects for the US stock market very much rest on whether the US economy will tip into recession. Our belief is that recession will be avoided, but we must be alive to that possibility as recessions often take hold with surprising speed. Every investor should always temper their enthusiasm as markets continue to rise, much as they should resist the temptation to become too despondent as they decline.
Nonetheless, the current high level of valuations are supported by the economic backdrop and shouldn’t preclude further stock market progress being made in the coming weeks and months.
Justin Oliver
If you would like to be removed from this Monday morning mail, please reply ‘unsubscribe’.
Capital at risk. For further details about any of Freedom’s investment strategies or a copy of any fund prospectus, please contact investor@freedomasset.com. Please note: The value and the income produced by strategies may fluctuate, so that an investor may get back less than initially invested. Value and income may be adversely affected by exchange rates, interest rates, or other factors. Levels and bases of taxation may change. Investors should consult their own tax advisor regarding their individual tax treatment with respect to the strategies referred to herein. This document does not represent a research report. The opinions expressed are those of the authors only, and may not be representative of, or shared by, Freedom Asset Management Limited or its affiliates. This email should not be considered to be an offering memorandum and is not an offer to sell nor a solicitation of an offer to purchase interests in any fund. Offers and sales will be made only pursuant for the current prospectus, constituent documentation and in accordance with applicable securities laws. A decision to invest in any of the funds should only be based upon review of such documents and these materials are qualified in their entirety by reference thereto.
Please note Freedom’s investment strategies are only available to Professional Investors, as determined by the relevant jurisdiction.
This message is intended solely for the addressee and may contain confidential or privileged information. If you have received this message in error, please permanently delete it and do not use, copy or disclose it. Freedom Asset Management Limited is licensed to carry on controlled investment business under the Guernsey Financial Services Commission (GFSC); Reference Number 2262946. The registered office of Freedom Asset Management Limited is: 2nd Floor, New Century House, 2 Jubilee Terrace, St Peter Port, Guernsey, GY1 1AH, Channel Islands. Freedom Asset Management (Middle East) Limited is authorised and regulated by Abu Dhabi Global Market (ADGM) Financial Services Regulatory Authority, No: 250016. The registered office address of Freedom Asset Management (Middle East) Limited is Office 2406, Tamouh Tower, Al Reem Island, Abu Dhabi Global Markets, Abu Dhabi, United Arab Emirates. Freedom Asset Management (Asia) Limited, holds a Type 9 Asset Management license from the Securities and Futures Commission in Hong Kong, Ref: BUR351. The registered office of Freedom Asset Management (Asia) Limited is Rm 97 5/Fl United Centre, 95 Queensway, Admiralty, Hong Kong.
© 2025 Freedom Asset Management Limited.